Connect with us

News

Paxton, Missouri AG, sue White House over border policy

Texas Attorney General Ken Paxton and Missouri Attorney General Eric Schmitt filed a lawsuit against the Biden Administration Tuesday requesting the White House reinstate the Trump-era Migrant Protection Protocols.

Published

on

(Texas News Radio) — Texas Attorney General Ken Paxton and Missouri Attorney General Eric Schmitt filed a lawsuit against the Biden Administration Tuesday requesting the White House reinstate the Trump-era Migrant Protection Protocols.

The attorneys general say it would reduce the ongoing crisis on the Mexican border.

The former policy had migrants seeking asylum “remain in Mexico” while their immigration cases are being processed.  The two Republicans say reinstating the policy would greatly reduce the burden put on state and federal offices responsible for protecting the border.

The Migrant Protection Protocols were enacted in 2019 and rescinded shortly after President Joe Biden took office earlier this year.

“President Biden could immediately remedy the influx of crime pouring across our border by reinstating the Migrant Protection Protocols. Dangerous criminals are taking advantage of the lapse in law enforcement and it’s resulting in human trafficking, smuggling, a plethora of violent crimes, and a massive, unprecedented burden on state and federal programs for which taxpayers must foot the bill,” said Attorney General Paxton. “We cannot allow this lawlessness to destroy our communities any longer. President Biden must act.”

Continue Reading

News

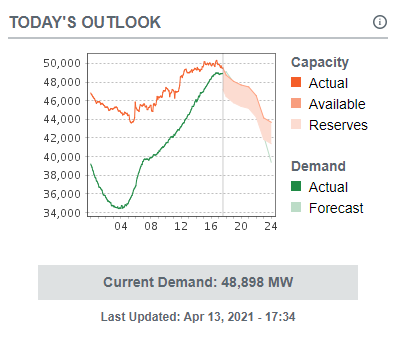
ERCOT urges power conservation during spring storm event

Published

on

(Photo: ERCOT)

(Texas News Radio) — The Electric Reliability Council of Texas is asking Texas power users to reduce consumption Tuesday afternoon into Tuesday evening because of springtime weather in the state.

“Due to a combination of high generation outages typical in April and higher-than-forecasted demand from a stalled cold front over Texas, ERCOT may enter into emergency conditions this afternoon,” said ERCOT Vice President of Grid Planning and Operations Woody Rickerson. “Given the event in February, it is important to note that we do not expect customer outages. Rather, this emergency declaration allows us to access tools that will bring supply and demand back into line.”

ERCOT

The state is currently seeing scattered thunderstorms across the state with temperatures as low as the mid-50s in the Permian Basin area to as high as the upper-80s in south and southeast Texas.

Continue Reading

News

Texas temporarily pauses Johnson & Johnson coronavirus vaccine administration

The Texas Department of State Health Services requested vaccine providers in the state to pause their administration of the Johnson & Johnson coronavirus vaccine following CDC and FDA guidance Tuesday to pause the vaccine’s distribution.

Published

on

BEXAR COUNTY (Texas News Radio) — The Texas Department of State Health Services requested vaccine providers in the state to pause their administration of the Johnson & Johnson coronavirus vaccine following CDC and FDA guidance Tuesday to pause the vaccine’s distribution.

The pause is due to six recipients of the vaccine of the 6.8 million who have received it nationally developing blood clots six to 13 days after receiving the Johnson & Johnson vaccine.  None of these cases are of Texans.  More than 500,000 Texans have received the Johnson & Johnson vaccine.

“The State of Texas is working in tandem with the federal government and vaccine providers to temporarily pause all administration of the Johnson & Johnson vaccine. While no cases of blood clots have been reported in Texas, we are taking the reports of rare adverse effects seriously and are working to ensure that COVID-19 vaccines administered in our state continue to be safe and effective,” Texas Gov. Greg Abbott said in a statement Tuesday.  “Vaccines are a crucial tool to mitigating the spread of COVID-19 and remain the most effective way to combat the virus in our communities. I continue to encourage Texans who wish to receive the Pfizer or Moderna vaccines to sign up.”

People who have received the Johnson & Johnson vaccine who develop a severe headache, abdominal pain, leg pain, or shortness of breath within three weeks after vaccination should contact their health care provider.

Continue Reading

Austin

Coming and going: where new Texans are coming from

The Texas population continues to grow, but where in the world are all of these people coming from?

Published

on

SAN ANTONIO (Texas News Radio) — The Texas population continues to grow, but where in the world are all of these people coming from?

The story varies by metro area

The data is based off U.S. Census Bureau migration estimates from 2012 to 2016.

1. Dallas-Fort Worth (7,233,323)

Dallas-Fort Worth is the most-populated metropolitan area in the entire state of Texas. Most people who move to the region are from other parts of the state, though there is a large percentage that come from other large metro areas like Los Angeles and New York.

Below are the estimated number of people who moved to or left the Dallas-Fort Worth metro area and where they came from or left to.

Top sources:

  1. Houston 14,980
  2. Austin 9,041
  3. Los Angeles 8,330
  4. San Antonio 7,273
  5. New York 6,214
  6. Chicago 5,079
  7. Atlanta 4,224
  8. Lubbock 3,211
  9. Washington 3,182
  10. Killeen-Temple 3,038

Top destinations:

  1. Houston 16,612
  2. Austin 11,449
  3. San Antonio 6,493
  4. College Station-Bryan 4,799
  5. Lubbock 4,658
  6. Oklahoma City 4,130
  7. Los Angeles 3,595
  8. Abilene 3,355
  9. Atlanta 3,251
  10. Tyler 2,969

While the numbers above show the volume of people moving, the figures below show where the metro area is gaining more people from than losing them to.

Highest net gain:

  1. Los Angeles 4,735
  2. New York 3,281
  3. Chicago 2,616
  4. San Juan, PR 1,579
  5. Shreveport 1,475
  6. Killeen-Temple 1,245
  7. San Diego 1,170
  8. El Paso 1,162
  9. Kansas City 1,049
  10. San Francisco 1,039

Highest net loss:

  1. Austin -2,408
  2. College Station-Bryan -2,276
  3. Abilene -1,804
  4. Houston -1,632
  5. Lubbock -1,447
  6. Longview -1,414
  7. Seattle -1,223
  8. Denver -975
  9. Portland -864
  10. Tyler -592
  11. Sherman-Denison -592
  12. Midland -552

2. Houston (6,772,470)

Top sources:

  1. Dallas-Fort Worth 16,612
  2. Austin 9,430
  3. San Antonio 7,163
  4. New York 6,277
  5. Chicago 5,932
  6. Los Angeles 5,007
  7. Washington 4,405
  8. College Station-Bryan 4,172
  9. Beaumont 4,021
  10. Miami 3,406

Top destinations:

  1. Dallas-Fort Worth 14,980
  2. Austin 13,987
  3. San Antonio 8,779
  4. College Station-Bryan 7,031
  5. Beaumont 4,670
  6. Los Angeles 2,775
  7. Chicago 2,576
  8. Denver 2,532
  9. New Orleans 2,515
  10. Corpus Christi 2,468

Highest net gain:

  1. New York 3,813
  2. Chicago 3,356
  3. Washington 3,270
  4. Los Angeles 2,232
  5. Miami 1,976
  6. Dallas-Fort Worth 1,632
  7. St. Louis 1,447
  8. Orlando 1,375
  9. San Diego 1,307
  10. McAllen-Edinburg-Mission 1,210

Highest net loss:

  1. Austin -4,557
  2. College Station-Bryan -2,859
  3. San Antonio -1,616
  4. Lubbock -859
  5. Beaumont -649
  6. Seattle -584
  7. San Jose -578
  8. Sherman-Denison -391
  9. San Angelo -390
  10. Denver -386

3. San Antonio (2,429,609)

Top sources:

  1. Houston 8,779
  2. Austin 8,076
  3. Dallas-Fort Worth 6,493
  4. McAllen-Edinburg-Mission 3,349
  5. Corpus Christi 2,682
  6. Laredo 2,018
  7. Washington 1,881
  8. Los Angeles 1,820
  9. El Paso 1,807
  10. Killeen-Temple 1,528

Top destinations:

  1. Austin 9,959
  2. Dallas-Fort Worth 7,273
  3. Houston 7,163
  4. Corpus Christi 3,176
  5. College Station-Bryan 2,399
  6. Washington 1,948
  7. Lubbock 1,466
  8. Killeen-Temple 1,397
  9. McAllen-Edinburg-Mission 943
  10. El Paso 932

Highest net gain:

  1. McAllen-Edinburg-Mission 2,406
  2. Houston 1,616
  3. Los Angeles 954
  4. Brownsville-Harlingen 881
  5. El Paso 875
  6. Phoenix 859
  7. San Diego 797
  8. Chicago 672
  9. Midland 610
  10. Tampa 566

Highest net loss:

  1. Austin -1,883
  2. College Station-Bryan -1,254
  3. Lubbock -891
  4. Dallas-Fort Worth -780
  5. Corpus Christi -494
  6. Chattanooga -471
  7. Nashville -395
  8. Cleveland -318
  9. Texarkana -302
  10. St. Louis -279

4. Austin (2,056,405)

Top sources:

  1. Houston 13,987
  2. Dallas-Fort Worth 11,449
  3. San Antonio 9,959
  4. Killeen-Temple 3,248
  5. New York 3,065
  6. Los Angeles 2,702
  7. Chicago 1,841
  8. College Station 1,707
  9. McAllen-Edinburg-Mission 1,609
  10. Washington 1,547
  11. Corpus Christi 1,456
  12. Phoenix 1,415
  13. San Francisco 1,364
  14. Waco 1,234
  15. Miami 1,074
  16. Lubbock 1,046
  17. Brownsville-Harlingen 1,032
  18. Denver 1,031

Top destinations:

  1. Houston 9,430
  2. Dallas-Fort Worth 9,041
  3. San Antonio 8,076
  4. Killeen-Temple 3,101
  5. College Station-Bryan 2,045
  6. Corpus Christi 1,672
  7. New York 1,581
  8. Los Angeles 1,410
  9. Phoenix 1,197
  10. Chicago 1,195
  11. Atlanta 1,157
  12. Washington 1,156
  13. Denver 1,144
  14. Waco 1,143
  15. Seattle 1,079

Highest net gain:

  1. Houston 4,557
  2. Dallas-Fort Worth 2,408
  3. San Antonio 1,883
  4. New York 1,484
  5. Los Angeles 1,292
  6. McAllen-Edinburg-Mission 900
  7. San Francisco 799
  8. El Paso 667
  9. Chicago 646
  10. Las Vegas 615

Highest net loss:

  1. College Station-Bryan -338
  2. Seattle -320
  3. Hartford -313
  4. Longview -302
  5. Nashville -288
  6. Raleigh -239
  7. Pensacola -239
  8. Atlanta -228
  9. Oklahoma City -227
  10. Beaumont -221

5. McAllen-Edinburg-Mission (849,843)

Top sources:

  1. Brownsville-Harlingen 2,096
  2. Houston 1,749
  3. Dallas-Fort Worth 929
  4. San Antonio 943
  5. Austin 709
  6. Corpus Christi 329
  7. Chicago 322
  8. Yakima 297
  9. Laredo 280
  10. San Jose 230

Top destinations:

  1. San Antonio 3,349
  2. Houston 2,959
  3. Austin 1,609
  4. Corpus Christi 1,514
  5. Brownsville-Harlingen 1,199
  6. Dallas-Fort Worth 1,046
  7. Beaumont 530
  8. Laredo 324
  9. Phoenix 315
  10. College Station-Bryan 252
  11. St. Louis 246
  12. Detroit 218
  13. Chicago 202

Highest net gain:

  1. Brownsville-Harlingen 897
  2. Yakima 264
  3. Lake Charles 198
  4. Flint 168
  5. San Jose 167
  6. San Diego 154
  7. Salt Lake City 149
  8. Mount Vernon, WA 132
  9. Lansing 128
  10. Chicago 120
  11. Sarasota 113
  12. Madison 110

Highest net loss:

  1. San Antonio -2,406
  2. Houston -1,210
  3. Corpus Christi -1,185
  4. Austin -900
  5. Beaumont -428
  6. Phoenix -264
  7. College Station-Bryan -191
  8. Detroit -171
  9. New Orleans -160
  10. Gadsden, AL -148

6. El Paso (841,971)

Top sources:

  1. Las Cruces 2,278
  2. Dallas-Fort Worth 1,403
  3. Phoenix 952
  4. San Antonio 932
  5. Odessa 929
  6. Houston 912
  7. Lawton 747
  8. Riverside 642
  9. Chicago 607
  10. Fayetteville, NC 622

Top destinations:

  1. Dallas-Fort Worth 2,565
  2. Las Cruces 2,551
  3. San Antonio 1,807
  4. Houston 1,627
  5. Odessa 1,021
  6. Phoenix 1,004
  7. Albuquerque 981
  8. Austin 976
  9. Washington 840
  10. Los Angeles 837
  11. Killeen-Temple 745
  12. Denver 667
  13. Seattle 624
  14. Lubbock 583
  15. Honolulu 552
  16. Corpus Christi 516

Highest net gain:

  1. Lawton 547
  2. Watertown, NY 386
  3. St. Louis 363
  4. Riverside 339
  5. Fayetteville, NC 269
  6. Orlando 254
  7. Manhattan, KS 249
  8. Chicago 232
  9. San Diego 229
  10. San Juan, PR 216

Highest net loss:

  1. Dallas-Fort Worth -1,162
  2. San Antonio -875
  3. Albuquerque -762
  4. Houston -725
  5. Austin -667
  6. Corpus Christi -484
  7. Seattle -463
  8. Washington -388
  9. Lafayette, LA -381
  10. Columbus -378

7. Corpus Christi (454,726)

Top sources:

  1. San Antonio 3,176
  2. Houston 2,468
  3. Austin 1,672
  4. McAllen-Edinburg-Mission 1,514
  5. Dallas-Fort Worth 1,043
  6. Brownsville-Harlingen 658
  7. Pensacola 532
  8. El Paso 516
  9. College Station-Bryan 501
  10. Laredo 465

Top destinations:

  1. Houston 2,698
  2. San Antonio 2,682
  3. Austin 1,456
  4. Dallas-Fort Worth 1,087
  5. Killeen-Temple 566
  6. College Station-Bryan 371
  7. Virginia Beach 365
  8. McAllen-Edinburg-Mission 329
  9. Amarillo 260
  10. Oklahoma City 245

Highest net gain:

  1. McAllen-Edinburg-Mission 1,185
  2. Brownsville-Harlingen 552
  3. San Antonio 494
  4. El Paso 484
  5. Pensacola 337
  6. Laredo 311
  7. Los Angeles 256
  8. Beaumont 240
  9. Melbourne, FL 219
  10. Austin 216
  11. Denver 190
  12. Indianapolis 182
  13. Daytona Beach 141
  14. Nashville 138
  15. Harrisburg 129
  16. San Diego 126
  17. Lake Charles 122
  18. Odessa 113
  19. Milwaukee 105
  20. Riverside 103

Highest net loss:

  1. Killeen-Temple -438
  2. Houston -230
  3. Port St. Lucie, FL -229
  4. Chico, CA -206
  5. Scranton -176

8. Killeen-Temple (435,857)

Top sources:

  1. Austin 3,101
  2. Dallas-Fort Worth 1,793
  3. Houston 1,603
  4. San Antonio 1,397
  5. Waco 1,205
  6. Seattle 1,201
  7. Fayetteville, NC 819
  8. New York 746
  9. El Paso 745
  10. Columbus, GA 632
  11. Kansas City 628
  12. Colorado Springs 592
  13. Cincinnati 588
  14. Corpus Christi 566
  15. Chicago 561
  16. Washington 557
  17. Douglas, AZ 517
  18. Honolulu 513
  19. Los Angeles 421
  20. College Station-Bryan 410

Top destinations:

  1. Austin 3,248
  2. Dallas-Fort Worth 3,038
  3. Houston 2,267
  4. San Antonio 1,528
  5. Waco 1,136
  6. Honolulu 986
  7. Colorado Springs 937
  8. Washington 785
  9. Atlanta 602
  10. Clarksville, TN 545

Highest net gain:

  1. Chicago 472
  2. Corpus Christi 438
  3. New York 418
  4. Fayetteville, NC 372
  5. Kansas City 355
  6. Seattle 345
  7. Los Angeles 339
  8. Macon-Bibb County, GA 271
  9. Columbus, GA 268
  10. El Paso 266
  11. Watertown, NY 233
  12. Miami 208

Highest net loss:

  1. Dallas-Fort Worth -1,245
  2. Houston -664
  3. Honolulu -473
  4. Atlanta -433
  5. Colorado Springs -345
  6. Denver -247
  7. Fort Knox, TN -246
  8. Washington -228
  9. Tampa -196
  10. Salem, OR -185

9. Brownsville-Harlingen (422,135)

Top sources:

  1. Houston 1,213
  2. McAllen-Edinburg-Mission 1,199
  3. San Antonio 545
  4. Austin 442
  5. College Station-Bryan 313
  6. San Diego 277
  7. Dallas-Fort Worth 273

Top destinations:

  1. McAllen-Edinburg-Mission 2,096
  2. Houston 1,483
  3. San Antonio 1,426
  4. Austin 1,032
  5. Dallas-Fort Worth 959
  6. Corpus Christi 658
  7. Miami 302
  8. Laredo 269
  9. Fort Myers. FL 259
  10. El Paso 173
  11. Highest net gain:

Highest net gain:

  1. San Diego 178
  2. College Station-Bryan 159
  3. Abilene 117
  4. Amarillo 117
  5. Tampa 116

Highest net loss:

  1. McAllen-Edinburg-Mission -897
  2. San Antonio -881
  3. Dallas-Fort Worth -686
  4. Austin -590
  5. Corpus Christi -552
  6. Houston -270
  7. Miami -268
  8. Fort Myers, FL -247
  9. Laredo -155
  10. Virginia Beach -110

10. Beaumont-Port Arthur (409,968)

Top sources:

  1. Houston 4,670
  2. Austin 835
  3. Dallas-Fort Worth 800
  4. McAllen-Edinburg-Mission 530
  5. San Antonio 502
  6. New Orleans 362
  7. Longview 346
  8. Lake Charles 344
  9. Asheville, NC 299
  10. Waterloo, IA 257
  11. Tyler 206

Top destinations:

  1. Houston 4,021
  2. Dallas-Fort Worth 1,287
  3. Austin 614
  4. Lubbock 523
  5. San Antonio 449
  6. Corpus Christi 429
  7. Lake Charles 323
  8. College Station-Bryan 278
  9. Victoria 235
  10. Miami 234

Highest net gain:

  1. Houston 649
  2. McAllen-Edinburg-Mission 428
  3. Asheville, NC 299
  4. New Orleans 284
  5. Waterloo, IA 241
  6. Austin 221
  7. Anchorage 176
  8. Longview 172
  9. Fairbanks, AK 160
  10. Gulfport-Biloxi 159

Highest net loss:

  1. Lubbock -490
  2. Dallas-Fort Worth -487
  3. Corpus Christi -240
  4. Victoria -235
  5. Miami -234
  6. College Station-Bryan -219
  7. Birmingham -180
  8. Texarkana -146
  9. Lafayette, LA -134
  10. El Paso -104

Continue Reading

Trending